PSPP Tutorial
Opening a Dataset | Tutorial Main Menu | Training Homepage | Copying to Word
Section Four: Analyzing a Dataset
In this section, we will cover how to perform an analysis of a dataset. As our sample data, we will use the example file "Physiology," which can be found under PSPP > Examples in the Start Menu under All Programs.
Performing and Exporting a Univariant Analysis

Figure 4-1
First, click on the Analyze menu to reveal the various statistical analyses that you can perform. For the purpose of this tutorial, we will be performing a frequency analysis.
Selecting this particular option allows you to analyze variables individually, rather than in relation to another variable. Performing this analysis, you can measure individual properties such as mean, median, mode, etc. To access this function, select Frequencies under Descriptive Statistics.

Figure 4-2
Once the Frequencies window appears, you can add the variables you would like to include in the analysis, moving them from the left list to the right by clicking the arrow. If you decide you don't want to include a variable you have added after all, simply select the variable in the right list, and click the arrow to move it back over to the left. Alternatively, you can simply double-click on the variables to move them. If you would like more statistical options, you can select them in the Statistics box on the bottom right of the window. When you're finished, click OK.

Figure 4-3
The output window should then appear, displaying the results of your analysis. Clicking on the + sign beside FREQUENCIES on the left will give you the option of viewing a particular section of the analysis. Double-click on the section heading to jump to it.

Figure 4-4
You can also export or print your analysis upon its completion. To export, open the File menu, and click on Export. Alternatively, you can delete the analysis by closing the Output window.

Figure 4-5
Navigating to the directory where you would like to save the file, select what format in which you would like the analysis to be saved.

Figure 4-6
When finished, click the Save button.
Note. If you do not close the output window after saving your analysis, any further analyses performed will be added to the output window.

Figure 4-7
Notice how the second analysis has been added below the first, to the effect that if you export or print the output window, both analyses will be printed in succession.
Performing a Bivariant Analysis
Now that we have covered the basics of analyzing data, we will perform a bivariant analysis on a larger dataset, namely "GSS 2008." This file can either be found on the Y: drive under GSS > GSS2008, or on the General Social Survey download website, which can be accessed by clicking here.

Figure 4-8
Once the dataset has been opened, open the Analyze menu, and click on the Crosstabs option under Descriptive Statistics.

Figure 4-9
When the Crosstabs window appears, right-click in the box on the left and uncheck Prefer variable labels, in order to make the variables easier to spot. Then, select the variable "Sex," and clicking on the top arrow, move it from the box on the left to the Row box on the top right. Going back to the left box again, select the variable "Zodiac," and click on the bottom arrow to move it over to the Columns box on the bottom right. Remember, the dependent variable goes into the Columns box, while the independent variable always goes into the Row box. When finished, click OK.

Figure 4-10
The results of your analysis will then appear in your output window.
Performing a Factor Analysis
To conduct a factor analysis, click the "Analyze" drop-down menu then choose the Factor Analysis option as shown in figure 4-11 below.
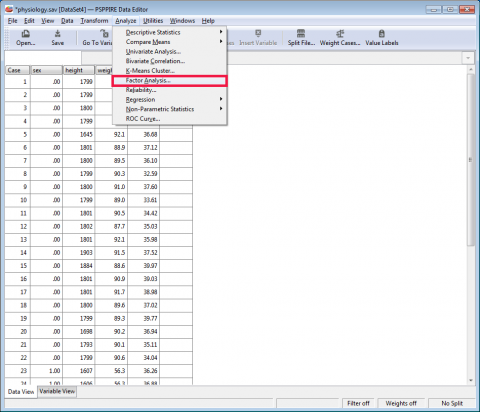
Figure 4-11
From the factor analysis window, choose each and every variable you would like to include in the data set then simply choose ok to return results in the output window.
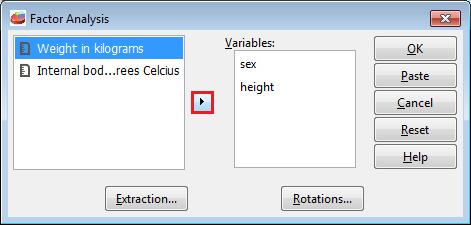
Figure 4-12
This is the extraction window. It grants numerous options such as to change the matrix type, display type and the maxium iterations for convergences.
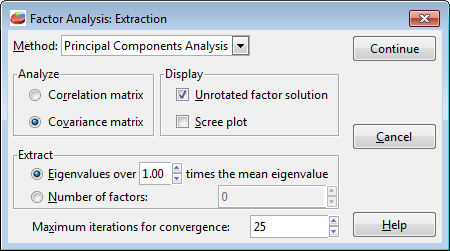
Figure 4-13
This window allows you to adjust the axis rotation. Make sure whichever method you choose, the Display rotated solution box is checked so it displays properly in the output window.
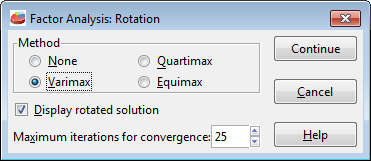
Figure 4-14
This is the factor analysis output window.
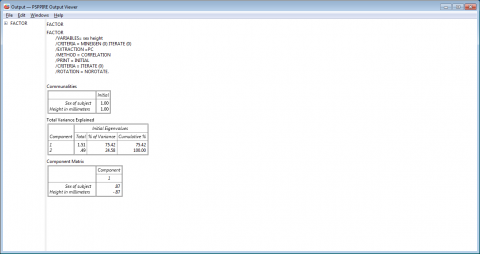
Figure 4-15
Performing a Linear Regression
Under the Analyze tab, choose Regression, then select Linear from the two choices.
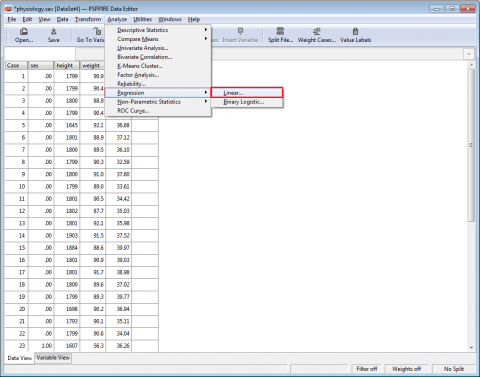
Figure 4-16
To conduct a Regression you need to separate the variables from the left list and organize them into the independent and dependent variable boxes on the right, as shown in Fig. 4-16 below.
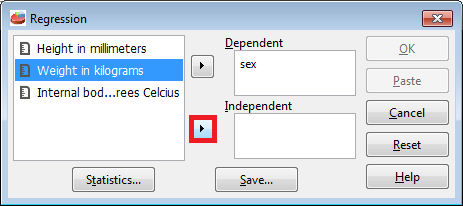
Figure 4-17
This is the linear regression output window.
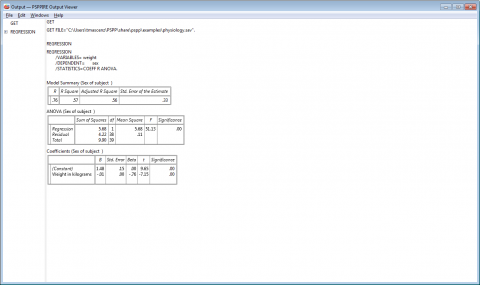
Figure 4-18

PSPP Tutorial by CHASS IT is licensed under a Creative Commons Attribution 3.0 Unported License.
Based on a work at it.chass.ncsu.edu/training/pspp.