PSPP Tutorial
Univariate Analysis | Tutorial Main Menu | Training Homepage | Multivariate Analysis
Section Five: Bivariate Analysis
In a bivariate analysis, neither variable in a study is independent, meaning both variables are dependent on one another. It is essentially a univariate analysis extended on two separate variables.
Performing a Bivariant Analysis
Now that we have covered the basics of analyzing data, we will perform a bivariant analysis on a larger dataset, namely "GSS 2008." This file can either be found on the Y: drive under GSS > GSS2008, or on the General Social Survey download website, which can be accessed by clicking here.
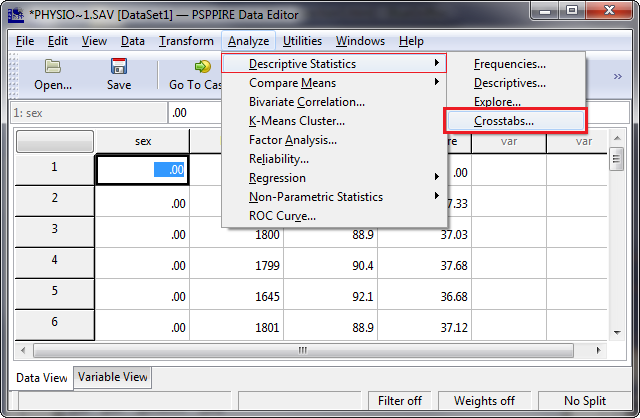
Figure 5-1
Once the dataset has been opened, open the Analyze menu, and click on the Crosstabs option under Descriptive Statistics.
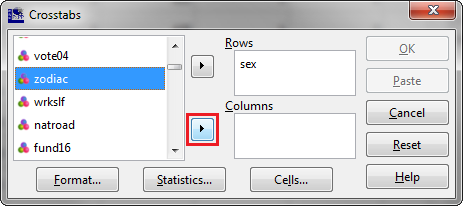
Figure 5-2
When the Crosstabs window appears, right-click in the box on the left and uncheck Prefer variable labels, in order to make the variables easier to spot. Then, select the variable "Sex," and clicking on the top arrow, move it from the box on the left to the Row box on the top right. Going back to the left box again, select the variable "Zodiac," and click on the bottom arrow to move it over to the Columns box on the bottom right. Remember, the dependent variable goes into the Columns box, while the independent variable always goes into the Row box. When finished, click OK.
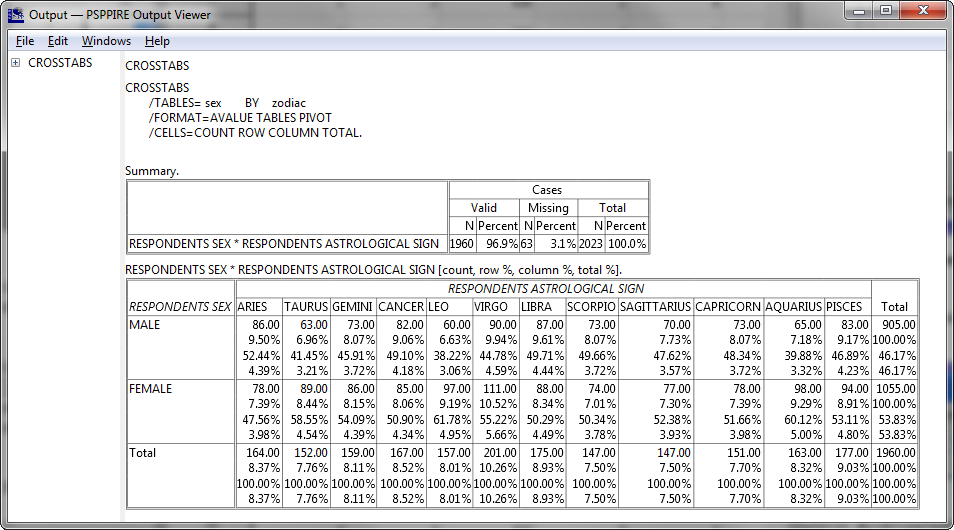
Figure 5-3
The results of your analysis will then appear in your output window.
Performing a Linear Regression
Under the Analyze tab, choose Regression, then select Linear from the two choices.
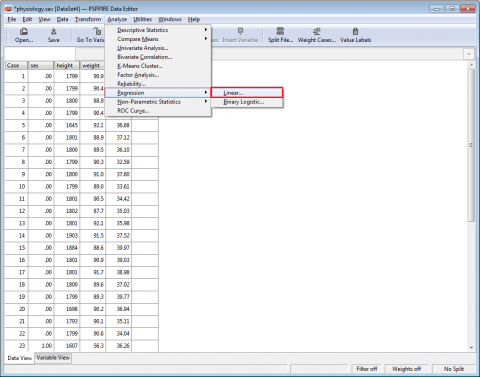
Figure 5-4
To conduct a Regression you need to separate the variables from the left list and organize them into the independent and dependent variable boxes on the right, as shown in Fig. 4-16 below.
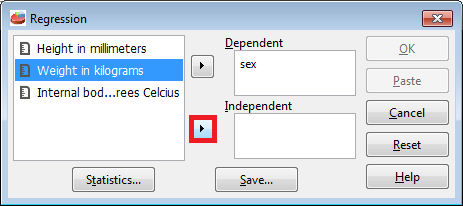
Figure 5-5
This is the linear regression output window.
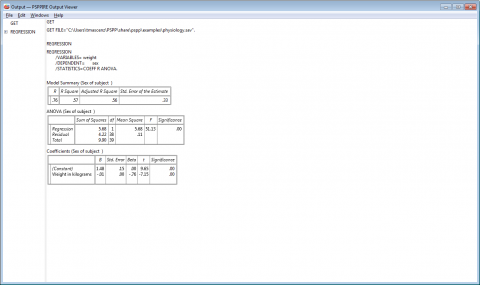
Figure 5-6
Changing the Cell Display
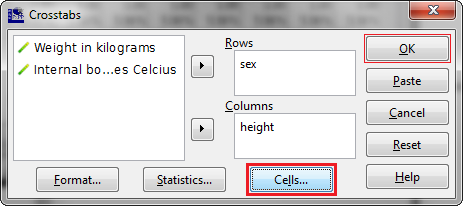
Figure 5-7
From the Crosstabs window, you can also change the cell display by clicking on the Cells button.
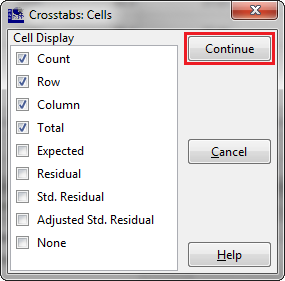
Figure 5-8
From here, you can select whatever display options you would like, and then click Continue.
More Statistical Options
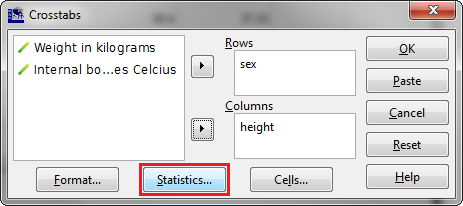
Figure 5-9
Also from the Crosstabs window, you can select a wider variety of statistical options, by clicking on the Statistics button.
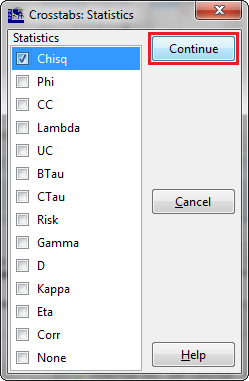
Figure 5-9
Since the "Chi-square" (Chisq) function is one of the more commonly used functions, we will select it, and click Continue.

Figure 5-10
The output window will appear, displaying the results of your chi-square test.
Recoding the Dataset
Analysis may also be performed by recoding the dataset, particularly if the amount of data is very substantial, in order to make it easier to work with.

Figure 5-11
To recode a large dataset into different variables, first open the Transform menu, and then select Recode into Different Variables.
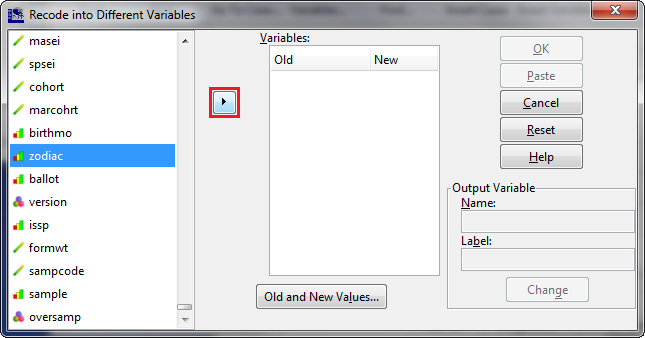
Figure 5-12
Once the window appears, select the variable you would like to recode, and then click on the arrow to move it to the Variables box on the right. In this case, we will select "Zodiac."
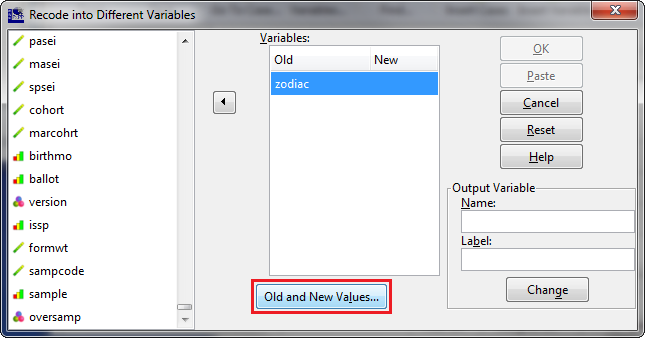
Figure 5-13
After the variable has been moved over to the right, click on the Old and New Values button.
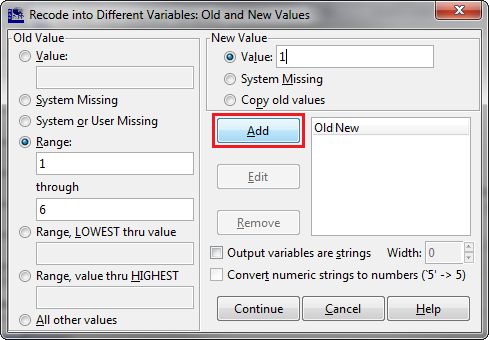
Figure 5-14
You may now enter the old and new values for your variable. In addition, you can also select a range of values, assigning a new value to that range. In this example, we will first input a range of 1 through 6 in the Old Value column, and assign a new value of 1 on the right. Then, click Add.
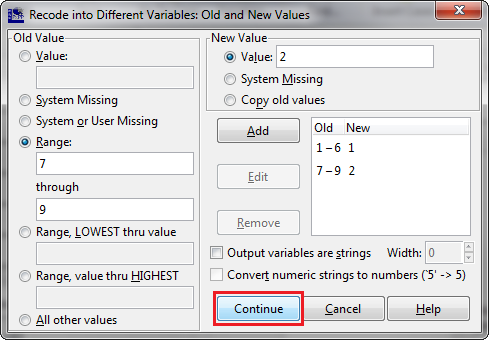
Figure 5-15
Then enter the second recoded variable, entering 7 through 9 under the range of the old value, entering a new value of 2, and click Add again. When finished, click on Continue.
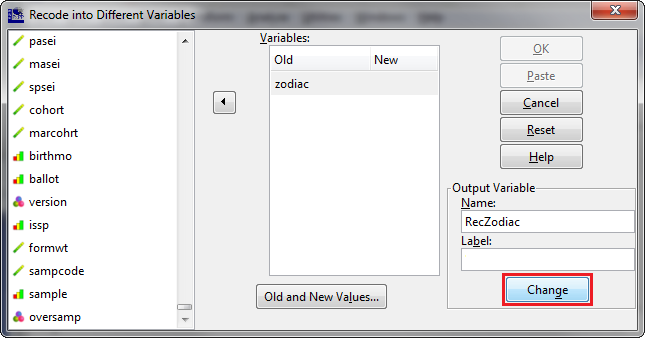
Figure 5-16
Now that the variable has been recoded, you will need to assign a name to it, in this example we will use the name "RecZodiac." Then, click Change.
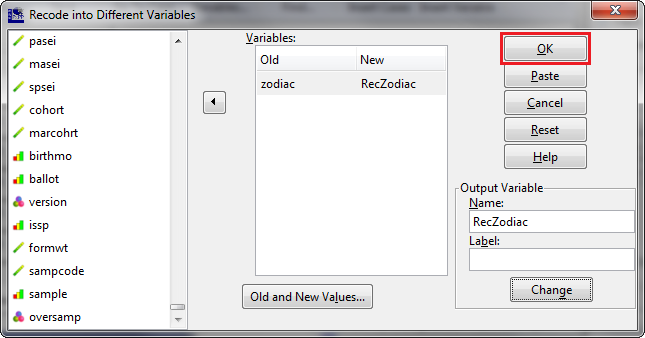
Figure 5-17
You will notice that the new name appears under the New column in the Variables box. Click OK when finished.
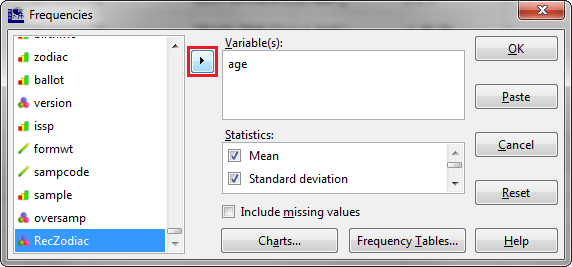
Figure 5-18
Using our newly-recoded variable, we will now perform a frequency analysis of "age" and "RecZodiac." Access the Frequencies window by clicking on Analyze from the main menu, and selecting the Frequencies option under Descriptive Statistics (see Fig. 4-8). When the window appears (see Fig. 4-23 above), first select the "Age" variable, clicking the arrow to move it to the Variable(s) box on the right. Then, do the same for the "RecZodiac" variable. When finished, click OK.
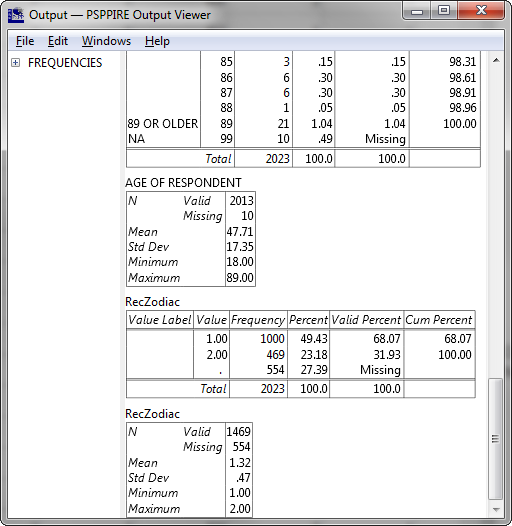
Figure 5-19
The results of your analysis will then appear in the output window.